
Fig. 3.
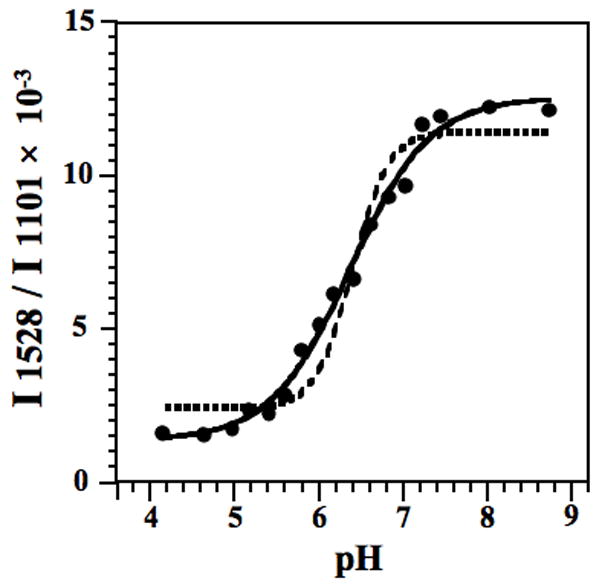
pH titration of HDV ribozyme crystals. The pKa of cytosine in an HDV ribozyme crystal (using the 2′-OCH3 substitution) containing 2 mM Mg2+ was fit using Eq. (2), as shown by the solid line. For comparison, the best fit using Eq. (2) with a Hill constant of 2 is shown with a dashed line. The model with a Hill constant of 1 provides the best description of the observed data. The y-axis is the relative intensity ratio of 1528 cm−1 band (neutral cytosine) to the intensity of the band at 1101 cm−1 (PO2−, internal standard). A pKa of 6.40 ± 0.05 at 2 mM Mg2+ was obtained. Reproduced with permission from [24]. (Copyright, American Chemical Society.)