
Fig. 4.
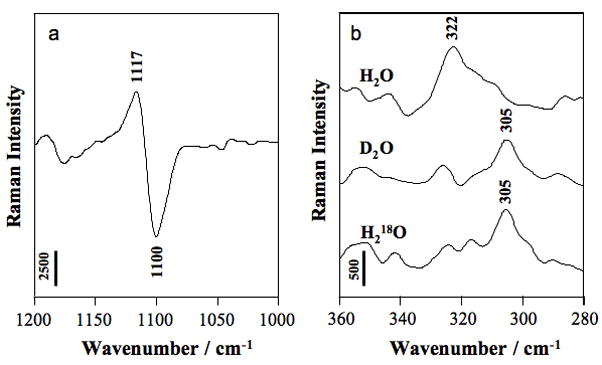
Raman difference spectra of HDV crystals [HDV + 20 mM Mg2+] minus [HDV no Mg2+] pH 6.0. Vertical bar represents photon events. (a) Partial Raman spectrum showing PO2− symmetric stretch of phosphate groups bound innersphere to Mg2+ at 1117 cm−1; the negative differential at 1100 cm−1 is due to phosphate symmetric stretch of metal-free groups. (b) Raman signatures of Mg hydrate (pentahydrate and tetrahydrate are both possible) bound innersphere to PO2− oxygen. Adapted with permission from [25]. (Copyright, American Chemical Society.)