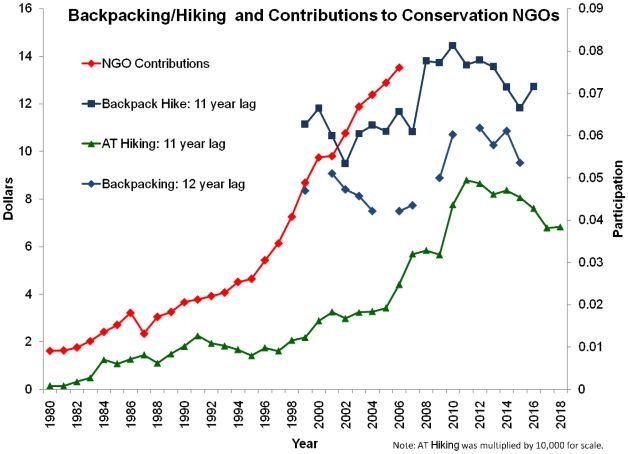
Figure 1. Comparing annual per capita contributions to conservation NGOs and participation in backpacking and hiking.
Gaps in the backpacking time series are due to lack of data for those years. “NGO contributions” is aligned with actual year of contribution on the x-axis. The backpacking and hiking series are shown lagged by +11 or +12 years to match the significantly correlated year of NGO revenue. In other words, data for “NGO Contributions” for 2006 are depicted on the graph at x-axis year 2006 along with the correlated data for “Backpack Hike” from 1995, “AT hiking” from 1995, and “Backpacking” from 1994. Based on the correlation between these variables we would project a decline in NGO contributions until at least 2018.

