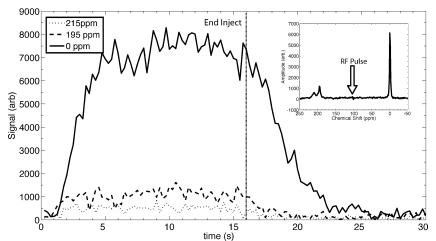
Figure 2:
Graph of time course of 129Xe signals during injection of 129Xe-saline mixture in the tail vein depicts the dynamics of the three resonances corresponding to 129Xe in blood (215 ppm), 129Xe in plasma or saline (195 ppm), and gaseous 129Xe in the airspaces (0 ppm). These resonances are shown in the inset spectrum, which was obtained by averaging the signals from 8 to 12 seconds. These spectral dynamics clearly illustrate that the airspace 129Xe peak is dramatically larger (and narrower) than that of the dissolved 129Xe resonances and is the most favorable peak for imaging. The dynamics were probed during a 30-second period at a repetition time of 250 msec, with the injection starting at frame 0 and lasting 16 seconds. Arb = arbitrary units, RF = radiofrequency.

