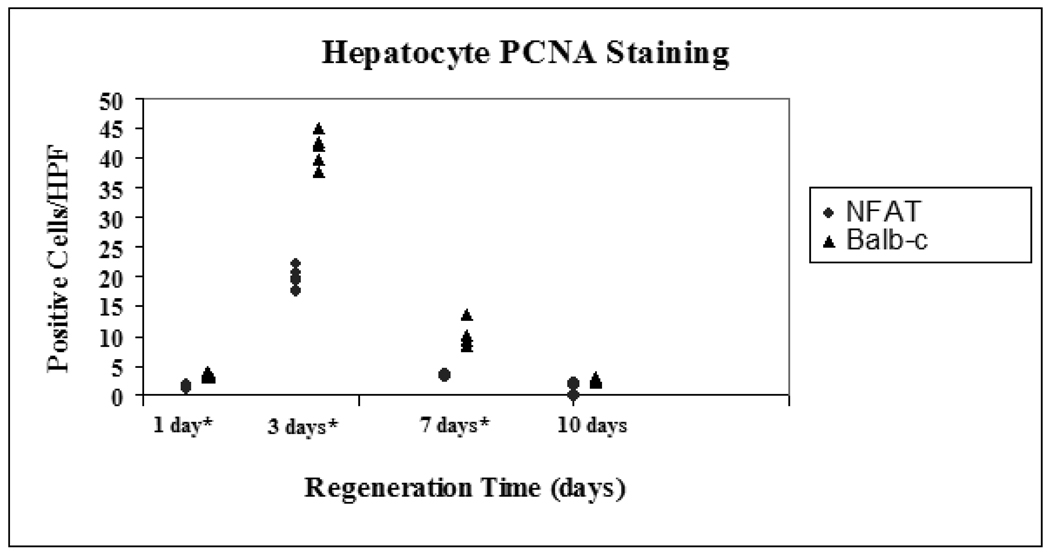
Figure 2.
PCNA staining of actively replicating cells
Median and ranges for PCNA staining of actively regenerating cells are graphed. Balb/c mice are represented by the black triangles and NFAT4 KO mice are represented by the gray circles. Asterisks represent significant values with p ≤ 0.05 taken as statistical significance.
* p < 0.05

