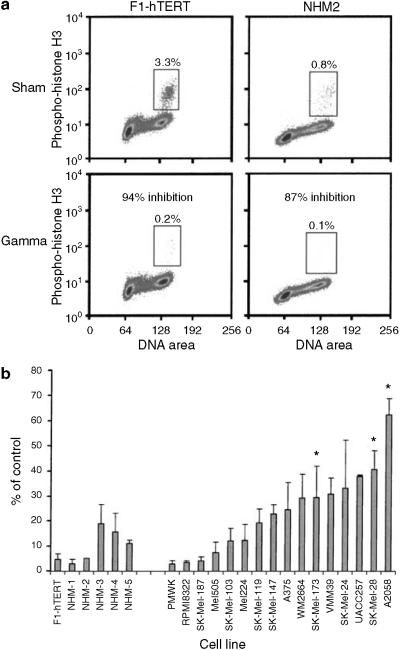
Figure 4. DNA damage G2 checkpoint function in NHMs and melanoma lines.
(a) Flow cytometric quantification of the percentage of mitotic cells with 4N DNA content and expression of phospho-histone H3 (enclosed by boxes). Normal human fibroblasts (NHF1-hTERT) and melanocytes (NHM-2) were treated with 1.5 Gy IR or sham treated, then harvested 2 hours later for quantification of mitotic cells. The IR-induced reduction in the fraction of mitotic cells was used as a quantitative measure of DNA damage G2 checkpoint function. (b) Quantification of DNA damage G2 checkpoint function in fibroblasts, melanocytes, and melanoma lines. The fraction of IR-treated cells in mitosis 2 hours after treatment was expressed as a percentage of the sham-treated control as a quantitative index of G2 checkpoint function. Results represent the mean percent of control; error bars enclose one standard deviation above the mean (n = 2-7). *P<0.05 versus NHMs, by Dunnett's t-test, with adjustment for multiple comparisons.

