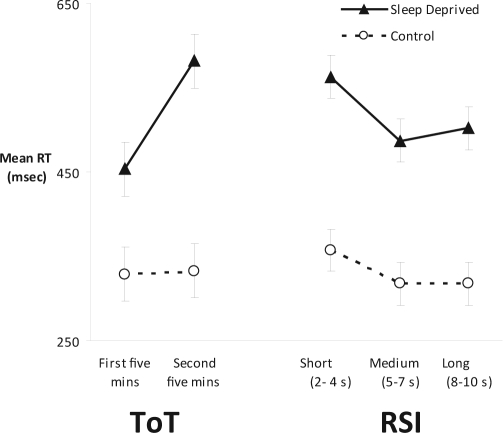
Figure 1.
Sleep deprivation and the readiness to perform across minutes and seconds. Mean reaction time (RT) is shown during runs 6-9 (Day 2) for control and sleep-deprived subjects. On the left, the data are broken up into the first 5 minutes and the second 5 minutes to display readiness to respond across minutes, or the time on task (ToT) effect. There is a significant ToT effect in the sleep-deprived subjects across the sleep-deprived runs and no significant ToT effect in control subjects across these same time points in the experiment. On the right, the data are broken up into short, medium, and long response-stimulus intervals (RSI) to display readiness to respond across seconds, or the variable RSI effect. Both the control and sleep-deprived subjects show a significant RSI effect. Symbols indicate the model estimated mean ± standard error.

