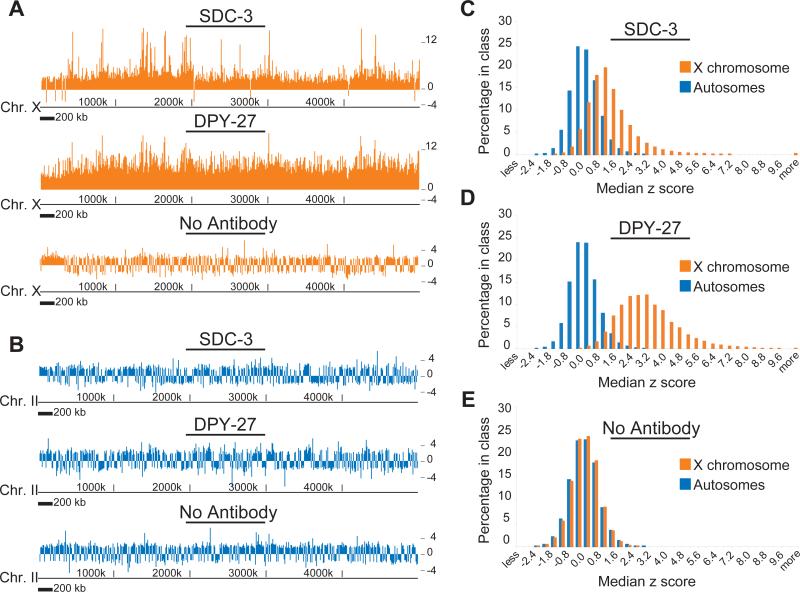
Figure 2. SDC-3 and DPY-27 bind specifically to the X with distinct modes of distribution.
(A) Median z scores of enrichment (calculated from ChIP/Input signals) following ChIP using antibodies to SDC-3, DPY-27 and a no antibody control, plotted along a 5 MB region from the left end of X. (B) Same as (a), plotted along a 5 MB region of chromosome II. (C-E) Histograms of the distribution of z-score ChIP enrichment values of individual probes for autosomes and X chromosomes. (C) SDC-3 ChIP, (D) DPY-27 ChIP and (E) a no antibody control ChIP.

