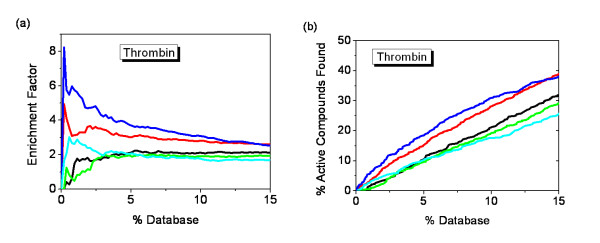
Figure 6.
Enrichment of 646 active compounds of thrombin in docking screens. (a) The enrichment factor of docking the database by MOFOM and individual scoring function. (b) The percentage of active compounds found by MOFOM and individual scoring function. The plot shows the results using five optimization methods: Energy score (black), Contact score (red), EFMOGA (cyan), MOEA_Nrg (green), and MOEA_Cnt (blue), respectively.

