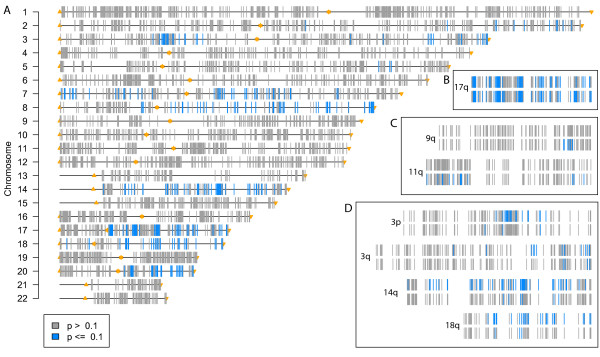
Figure 2.
Overview of associations found with Pollack's breast cancer data and the gene-set model. Chromosomes are represented by horizontal bars, and the arms are the gene sets used, with gene set edges marked by triangles and stars. Each vertical bar represents one copy number probe. The colour of the bar indicates the test result: blue, significant(FDR ≤ 0.10); grey, not significant (FDR > 0.10). Results on the left-hand side (A) refer to all tests done on the Pollack data set using the gene-set model. Insets on the right-hand side display gene-set (top) and gene-to-gene (bottom) p-values for a selection of chromosome arms (B: 17q, C: 9q and 11q; D: 3p, 3q, 14q and 18q).

