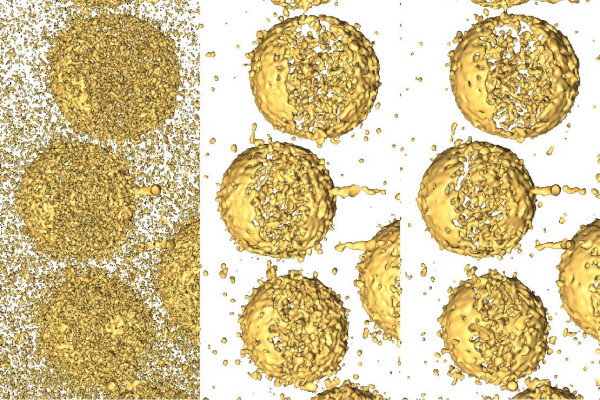
Figure 5.
Isosurface of the tomograms of unstained HIV-1 virions. From left to right, the 3D visualization of the original tomogram of unstained HIV-1 virions and the denoised versions with TOMOBFLOW (70 iterations) and the iterative median filtering (3 iterations) are shown. A slice of each tomogram was previously shown in Figure 4c. Both filtering methods allow the 3D inspection of the dataset, though TOMOBFLOW preserves more details at the membranes of the virions.

