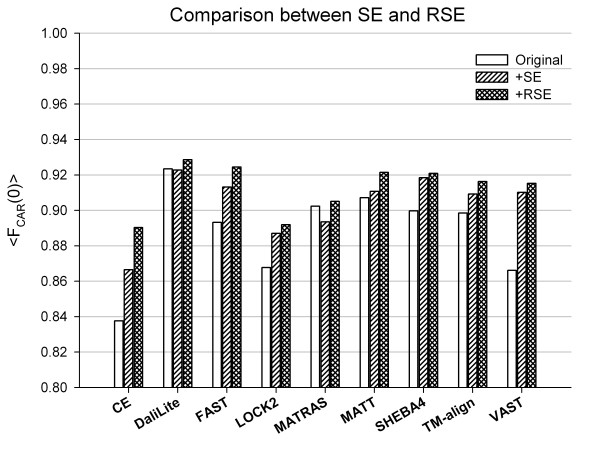
Figure 6.
Average fraction of correctly aligned residues before and after modification by either SE or RSE. The average accuracies of sequence alignment were computed for each method before (white) and after modification either by SE (hatched) or RSE (crosshatched). The method name is given under each group of three bars along the x-axis. The y-axis gives <FCAR(0)>, the average fraction of correctly aligned residues, averaged over the superfamily.

