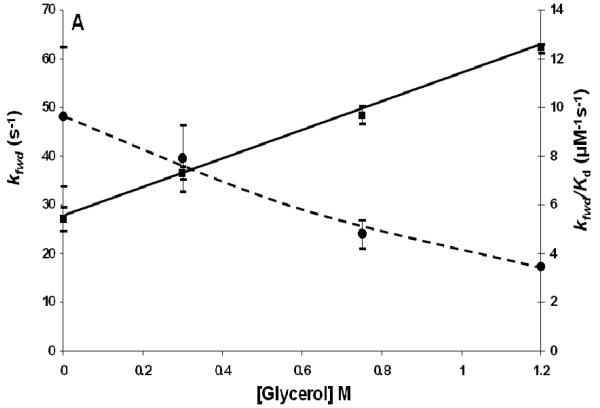
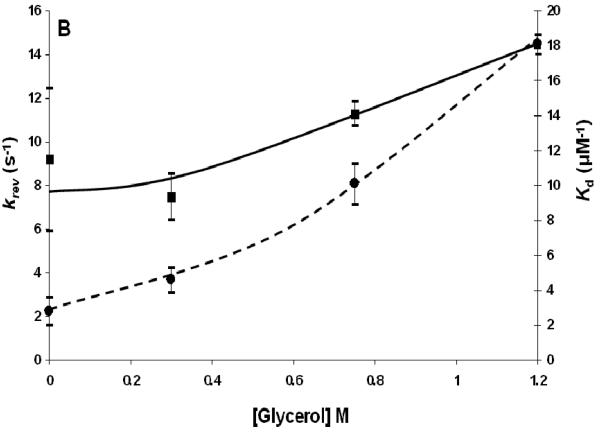
Fig. 2.
A) kfwd and kfwd/Kd for the SLN-R1∼P·YPD1 phosphotransfer reaction at different concentrations of glycerol. Curves are drawn by hand for kfwd (■) and kfwd/Kd(●). B) krev and Kd for the SLN-R1∼P·YPD1 phosphotransfer reaction at different concentrations of glycerol. Lines are drawn by hand for krev (■) and Kd (●).


