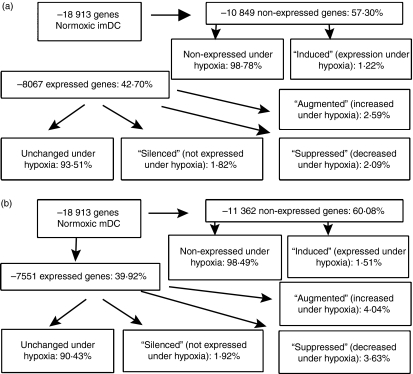
Figure 2.
Gene expression profiles in dendritic cells (DC) modulated by hypoxia environment. This schematic illustrates gene expression profiles in normoxic DC and hypoxic DC. Based on a greater than twofold difference in expression in hypoxic DC relative to normoxic DC, genes significantly altered were categorized as ‘silenced’, ‘downregulated’, ‘upregulated’ and ‘induced’. (a) The gene expression profiles in immature DC (imDC) cultured under normoxia or hypoxia. (b) The gene expression profiles in mature DC (mDC) cultured under normoxia or hypoxia.

