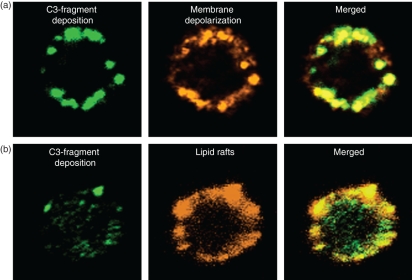
Figure 4.
Topographical relationship among membrane depolarization, C3-fragment deposition and lipid rafts. Purified B cells were incubated with autologous serum for 30 min at 37°. (a) Localization of C3 fragments (left) and membrane depolarization (middle), as assessed by staining with fluorescein isothiocyanate (FITC)-coupled anti-C3d and Alexa fluor 647-coupled annexin V, respectively. Merged figures (right) show co-localization (yellow colour). (b) Staining for C3 fragments with FITC–anti-C3d (left) and for lipid rafts, as assessed using tetramethyl rhodamine iso-thiocyanate (TRITC)-coupled cholera toxin subunit B (middle). Merged figures (right) show co-localization (greenish yellow).

