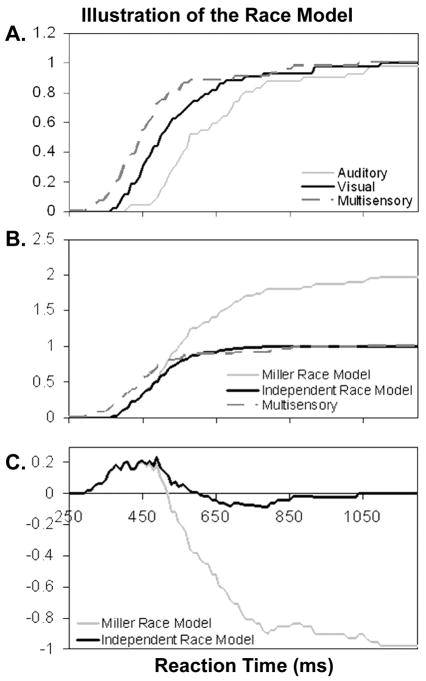
Figure 1. Illustration of the race model using data from a representative young subject.
(A) Illustrates cumulative distribution functions (CDFs) of reaction times to auditory, visual, and multisensory stimuli. Values on the y-axis represent cumulative the cumulative probability of response. The multisensory distribution is shifted to the left of the entire auditory distribution and most of the visual distribution, reflecting an overall speeding of responses in the multisensory condition. Note that all three CDFs begin at 0 and converge at 100%. (B) CDFs of Miller’s race model, the independent race model and observed reaction times to multisensory stimuli. The multisensory distribution is clearly shifted to the left of either race model at fast reaction times. Observe that the Miller inequality has a steeper slope than the independent race model and it sums to 200%. (C) Difference curves where each race model has been subtracted from the observed multisensory distribution. Positive deflections indicate time bins during which the observed probability of responding was greater than predicted by the race model. The Miller model becomes uninterpretable after it crosses the observed multisensory distribution, which can be seen in both B and C. Note that in the independent model, the negative deflection returns to 0 at later time bins as the CDFs of the race and multisensory converge.

