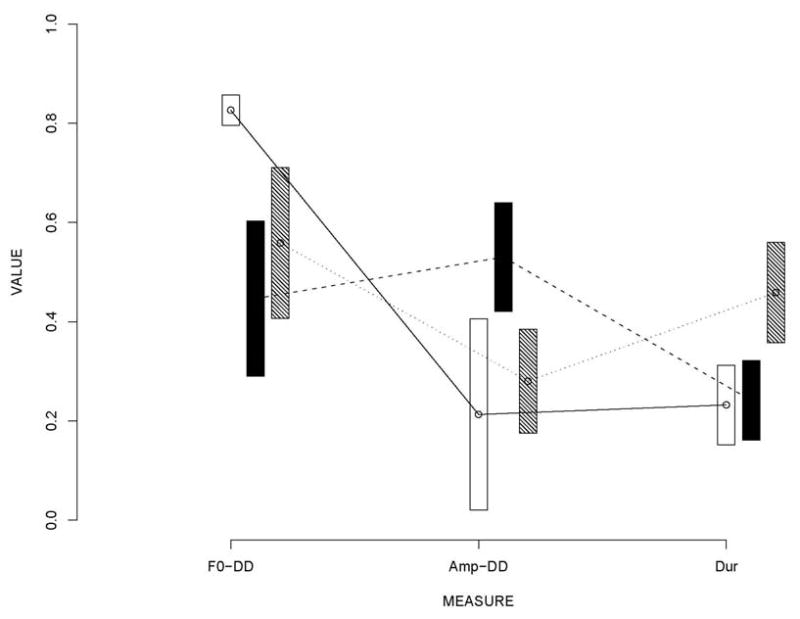
Figure 9.

Mean values (with standard errors, based on 8 utterances per child) of F0 dynamic difference, amplitude dynamic difference, and duration based measures for three children having approximately the same mean listener scores (in the 0.80 – 0.83 range) in the Focus Task. The children are identified by the shading of the error bars. The Figure illustrates the compensatory aspect of prosody, with each of the children expressing stress with a different balance between the three prosodic features.
