Figure 2.

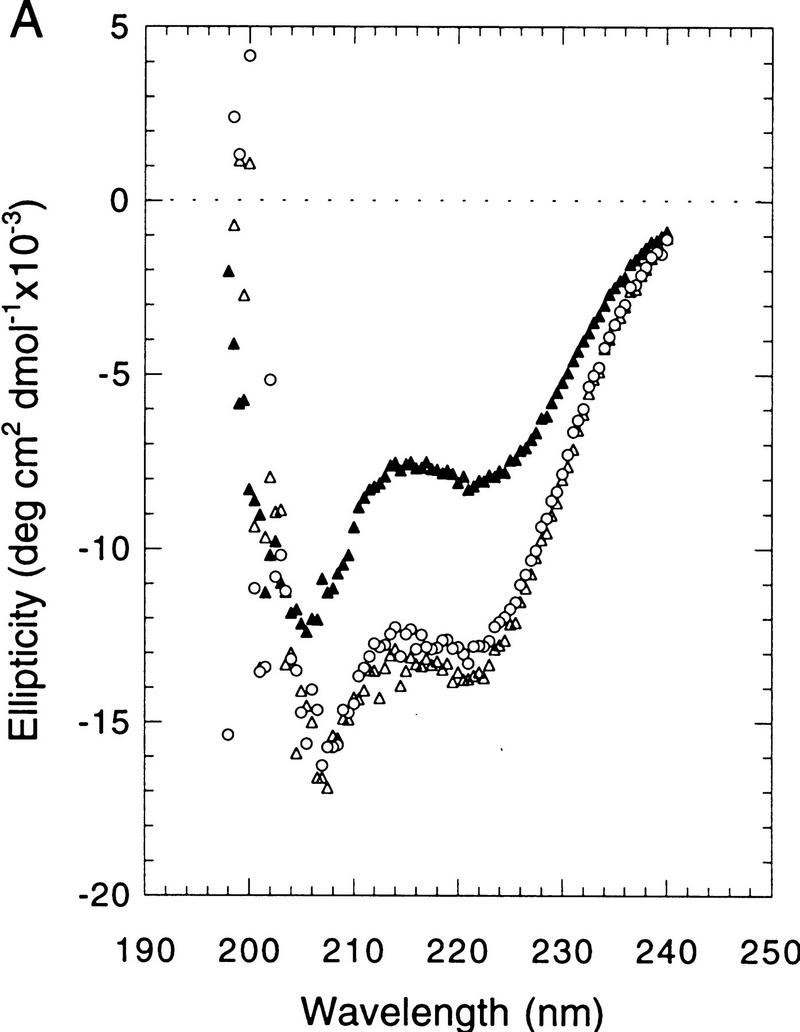
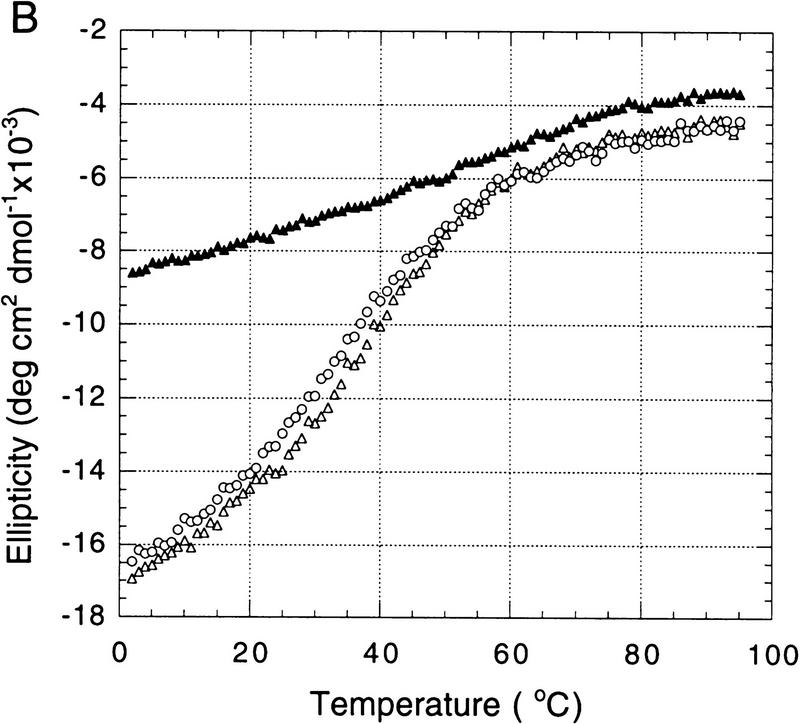
CD spectroscopy of Skn domain folding and DNA binding. (A) CD wavelength spectra of the Skn domain at 25°C. (▴) The spectrum of the Skn domain off DNA; (○ and ▵) the spectrum of the Skn domain–DNA complex before and after thermal unfolding, respectively (shown in B). (B) Thermal unfolding of the Skn domain. Ellipticity was monitored at 222 nm, as an indicator of α-helical content. (▴) Denaturation of the Skn domain off DNA; (○ and ▵) denaturation and renaturation of the Skn domain–DNA complex, respectively.

