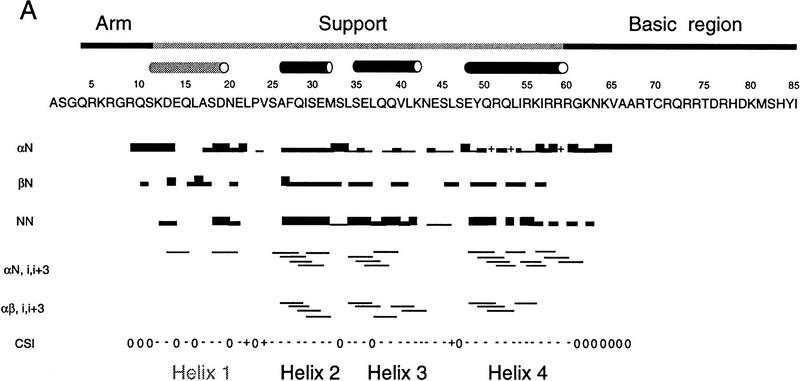
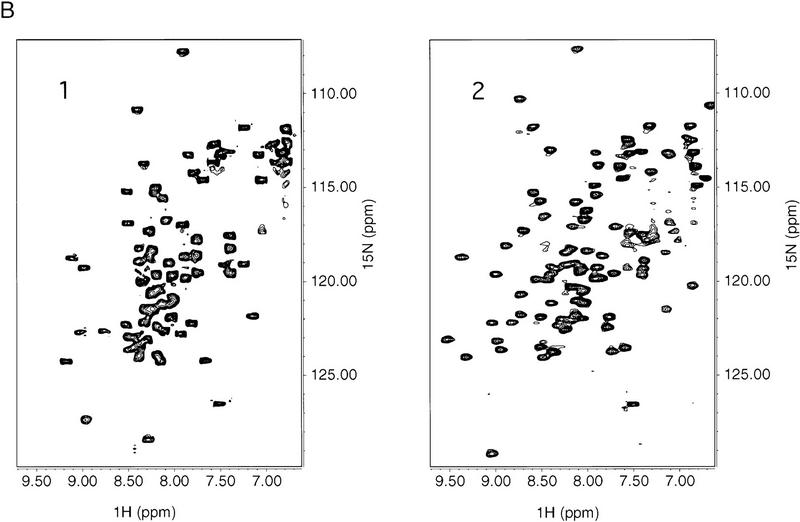
Figure 6.
NMR spectra of the Skn domain. (A) Summary of NOE data for the free Skn domain, numbered as in Fig. 1. The intensity of the sequential NOEs, αN, βN, and NN, is indicated by the thickness of the line. An overlap of resonances is indicated by +. The CSI is the chemical shift index for α protons (Wishart et al. 1992), in which 0 indicates a chemical shift close to random coil values, + indicates a chemical shift higher than random coil, and − indicates a value less than the random coil chemical shift. The approximate boundaries of helices 1–4 are indicated by cylinders. (B) HSQC spectra of free Skn domain (1) and 1:1 complex of Skn domain and DNA (2).


