
Fig. 5. Visualization of ceramide-dependent spinal cord apoptosis.
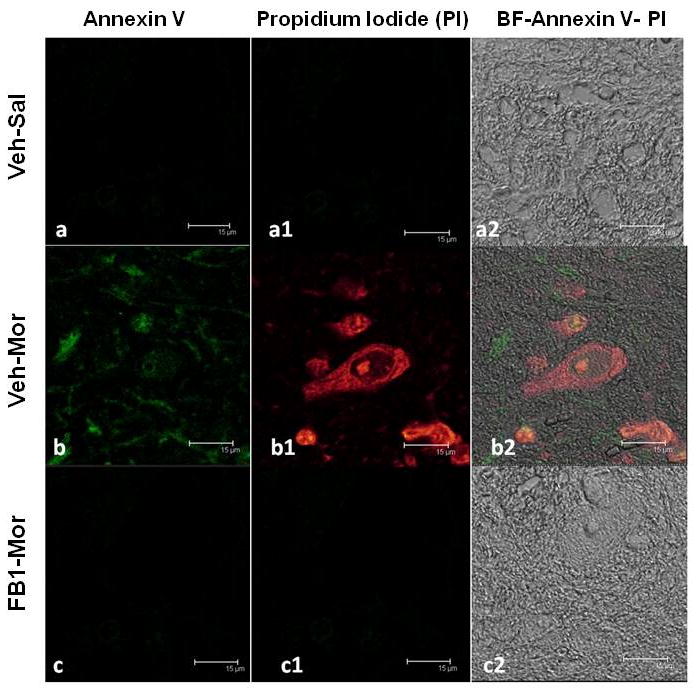
No apoptotic cells were detectable using Annexin-V FITC coloration in the spinal cord tissue of non-tolerant mice (A,A1). In tolerant animals a marked appearance of stain positive for Annexin-V FITC was observed (B). In addition, several cells showed positive staining with PI (B1). Spinal cord section from FB1-treated mice demonstrated a marked reduction in the number of apoptotic cells (C,C1). Figs A2, B2 and C2 represent the overlap images of panels A-A1, B-B1 and C-C1 respectively, superimposed on transmission light images of identical fields, depicting a significant number of cells captured in each field. Figure is representative of at least 3 independent experiments.