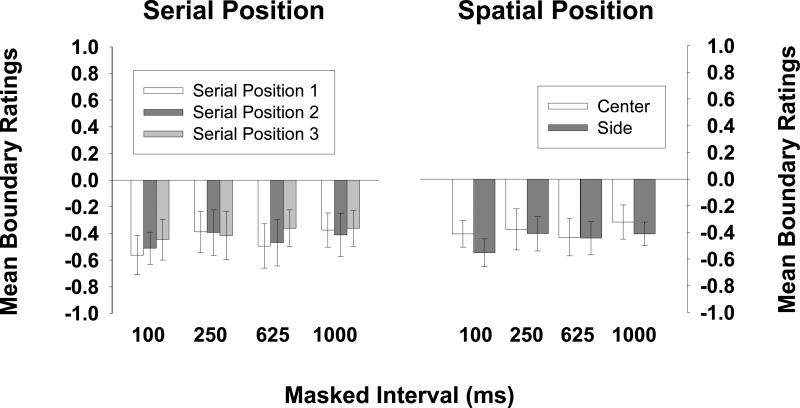
Figure 3.
Observers’ mean boundary ratings for each serial position of the target (collapsed across spatial position of the test picture) are shown on the left, and their mean boundary ratings for each spatial position of the test picture (center, side; collapsed across serial position of the target) are shown on the right, for each retention interval (Experiment 1). All error bars show the 95% confidence interval of the mean. Means that are significantly less than zero reflect boundary extension; means that are significantly greater than zero reflect boundary restriction.

