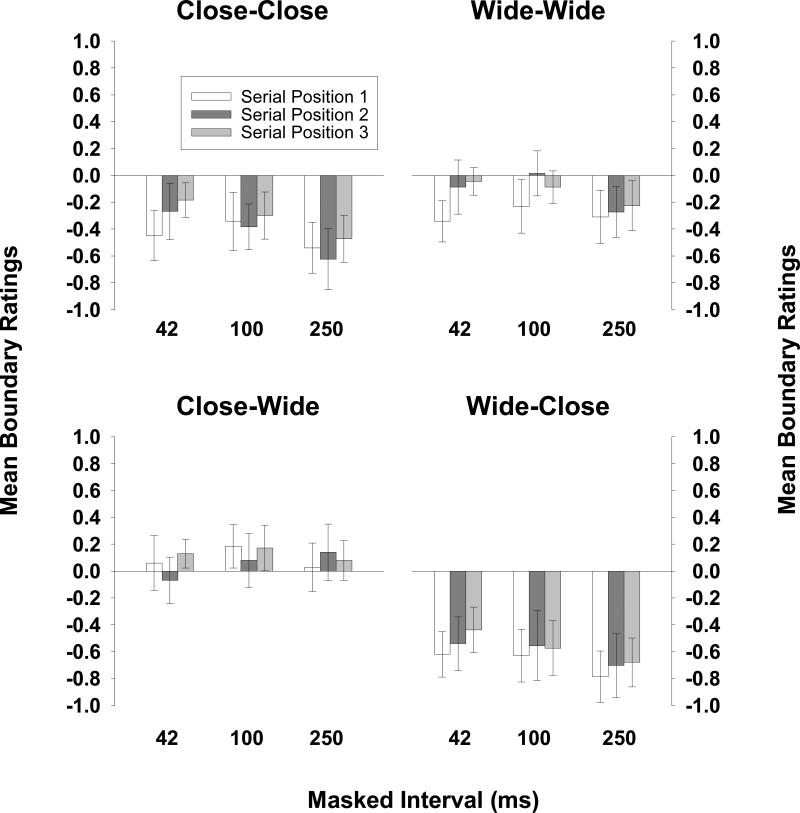
Figure 5.
Observers’ mean boundary ratings for CC trials are shown on the upper left, their mean boundary ratings for WW trials are shown on the upper right, their mean boundary ratings for CW trials are shown on the lower left, and their mean boundary ratings for WC trials are shown on the lower right, for each serial position of the target at each retention interval (Experiment 2).

