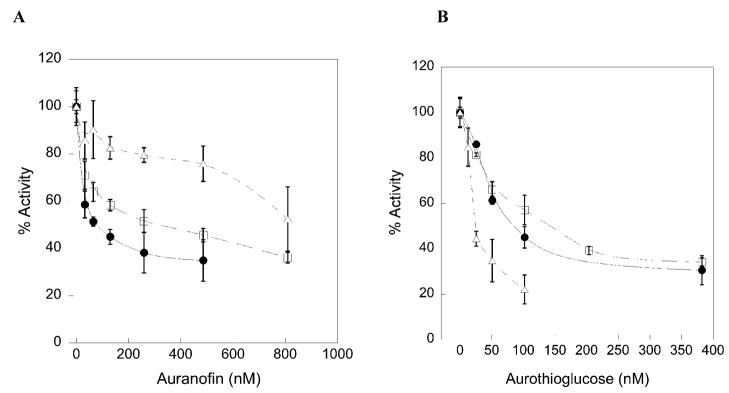
Figure 6.
Inhibition plots of TR using auranofin as an inhibitor (A) or aurothioglucose as an inhibitor (B) for mTRΔ8 (open triangles), mTR-GCCG (open squares), and mTR-GCUG (closed circles). IC50 values are calculated from this plot and reported in Table 6.

