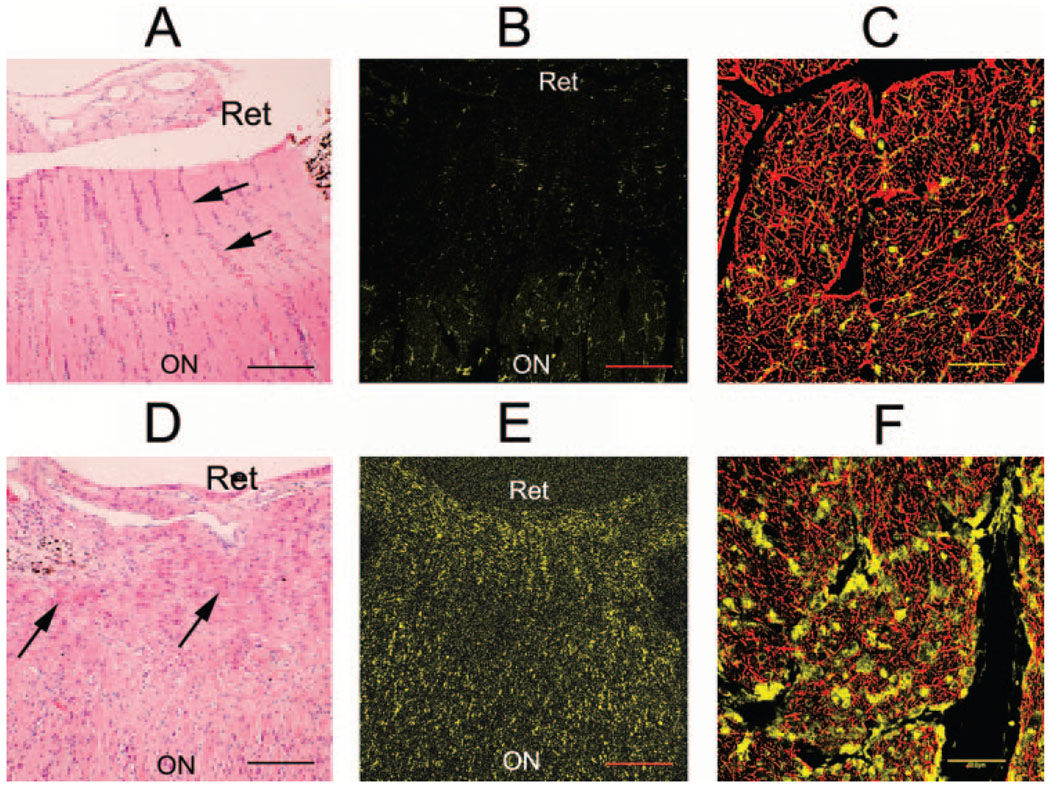
FIGURE 7.
Normal appearance of the ON of a control eye (A–C) versus inflammation in a nerve after induction of pNAION (D–F). (A, B, D, E) Longitudinal sections; (C, F) cross sections of ONs 1 cm posterior to the laminar region. (A) H&E-stained section of a proximal ON in a control eye. Columns of nuclei (arrows) were relatively evenly distributed throughout the nerve, interspersed with axonal (light pink) elements. (B) IBA-1–stained section of the same nerve showed only rare stained cells. (C) Confocal microscopy of a cross section of the ON from the control eye, double stained with antibodies to GFAP (red) and IBA-1 (yellow), showed a relative paucity of IBA-1–stained cell nuclei. (D) H&E-stained section of the proximal ON of a pNAION-induced eye. There was significant disruption of normal architecture associated with an increased number of cells and deposition of eosinophilic material (arrows) throughout the area. The cells are present in the prelaminar, laminar, and immediately retrolaminar regions. (E) IBA-1–stained section of the proximal ON from the pNAION-induced eye revealed many positively stained cells in the peripapillary region and interspersed throughout the prelaminar, laminar, and immediately retrolaminar regions (arrowheads). (F) Confocal microscopy of a cross section of the ON from the pNAION-induced eye, double-stained with antibodies for GFAP and IBA-1, ~1 cm posterior to the laminar region, well posterior to the ischemic lesion, double-stained with GFAP (red) and IBA-1 (yellow). Note numerous IBA-1–stained cell nuclei. Scale bars: (A, B, D, E) 100 µm; (C, F) 50 µm.

