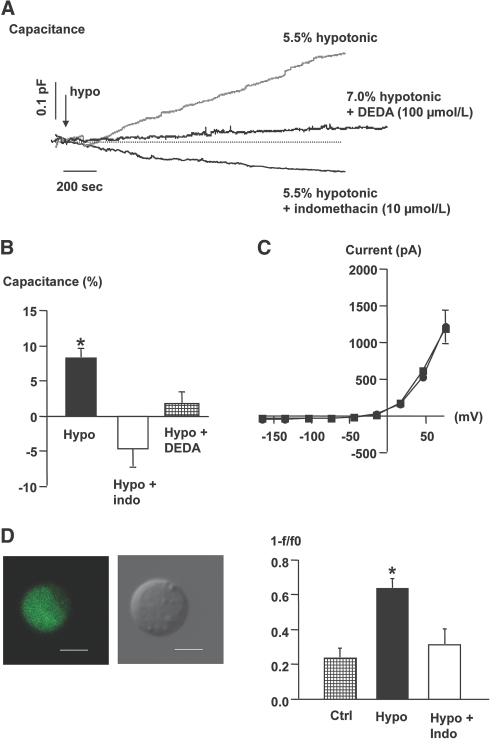
Figure 3.
(A) Recordings were obtained in single JG cells and show the effect of exposure to hypotonic fluid (arrow, −) on Cm without and with concomitant exposure of the cell to the COX inhibitor indomethacin (10 μmol/L) and a PLA2 inhibitor (DEDA) at 100 μmol/L. (B) The columns display average changes of Cm in response to a hypotonic stimulus (n = 8), a hypotonic stimulus with indomethacin (n = 4), and a hypotonic stimulus with DEDA ± SEM, n = 4. *P ≤ 0.05 at t = 0 versus t = 10 min. (C) The average current-voltage relationship was measured immediately after the whole-cell configuration was obtained (circles). The measurement was repeated 10 min after introduction of a hypotonic stimulus in cells exposed to indomethacin (squares), n = 4. (D) Direct visualization of renin release in single, isolated JG cells. Micrographs display confocal fluorescence image of a quinacrine-stained live JG cell (left) and the same cell as observed by phase-contrast microscopy (right). Bars represent 5 μm. The renin release rate was calculated as the ratio between start fluorescence (F0) and fluorescence after 40 frames (F). Data are shown as 1 − F/F0. The columns show change in quinacrine fluorescence in control cells (n = 6), in cells exposed to an acute reduction in extracellular osmolality (7%) in the absence (n = 5) and in the presence of indomethacin (10 μmol/L, n = 6). Values are mean ± SEM. *P ≤ 0.05 versus control.

