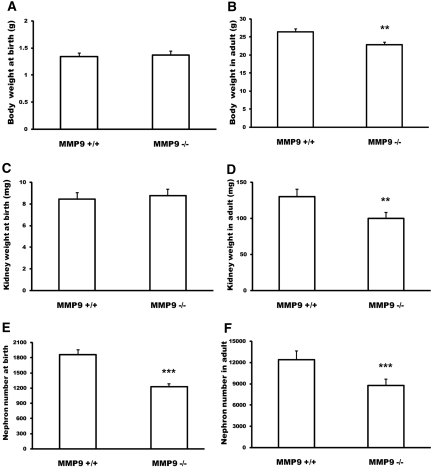
Figure 2.
Effect of MMP9 deficiency on mouse body weight, kidney weight, and nephron number. (A and B) Body weight of newborn (A) and adult (B) MMP9+/+ and MMP9−/− kidneys. (C and D) Kidney weight of newborn (C) and adult (D) MMP9+/+ and MMP9−/− kidneys. Kidney weight and body weight were similar at birth, whereas they were significantly decreased in adult MMP9−/− mice. (E and F) Nephron number in newborn (E) and adult (F) MMP9+/+ and MMP9−/− kidneys. Values are mean ± SEM. ***P < 0.001 and **P < 0.01 versus MMP9+/+ mice.

