Figure 3.
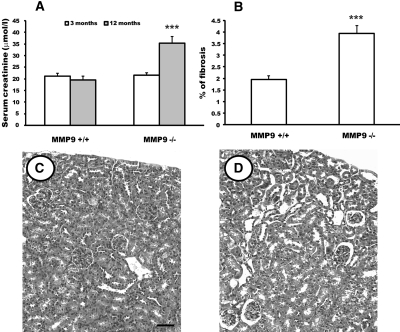
Effect of MMP9 deficiency on renal function, kidney fibrosis, and kidney morphology. (A) Serum creatinine level of MMP9+/+ and MMP9−/− kidneys at 3 (open bar) and 12 mo (gray bar). (B) Percentage of fibrosis in MMP9+/+ and MMP9−/− kidney sections at 12 mo. Five microphotographs (magnification, ×20) were taken from ten different MMP9−/− and MMP9+/+ kidneys. (C and D) Photomicrographs of representative paraffin kidney sections from MMP9+/+ (C) and MMP9−/− (D) mice stained with hematoxylin and eosin at 12 mo. Note that dilated tubules were observed in MMP9−/− kidney. Values are mean ± SEM. ***P < 0.001 versus MMP9+/+ mice; n = 20. Bar: 170 μm.

