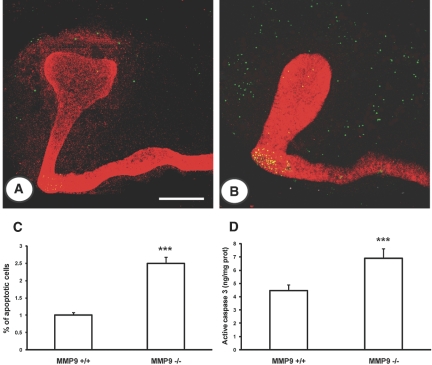
Figure 4.
Effect of MMP9 deficiency on apoptosis ex vivo. (A and B) Representative photographs of E11.5 kidneys from MMP9+/+ (A) and MMP9−/− mice (B) stained with calbindin D-28K to delineate ureteric bud in red and TUNEL method (apoptotic nuclei in green). (C) Percentage of apoptotic nuclei in E11.5 kidneys. Microphotographs were taken from 10 different MMP9+/+ and MMP9−/− kidneys. (D) Concentration of active caspase-3 in E11.5 kidneys, n = 50. Note that apoptosis assessed by different methods was increased in MMP9-deficient mesenchyme. Values are mean ± SEM. ***P < 0.001 versus MMP9+/+-injected mice. Bar: 250 μm.

