Figure 5.
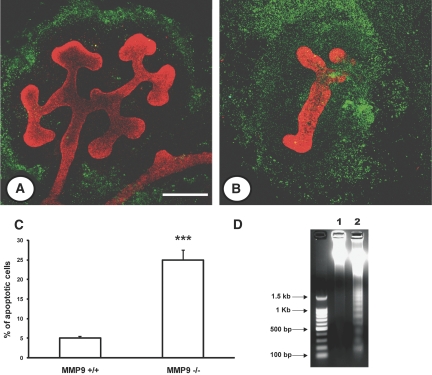
Effect of MMP9 deficiency on apoptosis in vitro. (A and B) Representative photographs of E11.5 kidneys from MMP9+/+ (A) and MMP9−/− mice (B) grown for 48 h in culture. Ureteric bud is stained with calbindin D-28K (red) and apoptotic nuclei by the TUNEL method (green). (C) Percentage of apoptotic nuclei in E11.5 kidneys grown for 48 h. (D) Genomic DNA extracted from E11.5 control (lane 1) and MMP9−/− kidney (lane 2) grown for 48 h in culture. The migration profile in lane 2 is characteristic of apoptosis. Values are mean ± SEM. ***P < 0.001 versus MMP9+/+ mice, n = 20. Bars: (A and B) 250 and (E and F) 25 μm.

