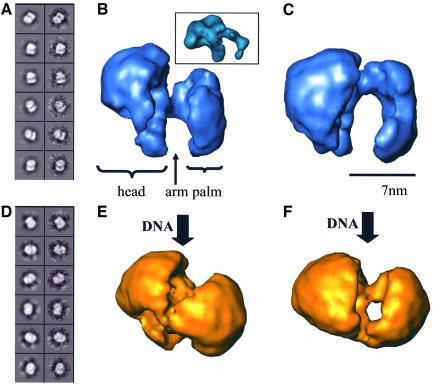
Fig. 3. 3D structure of DNA-PKcs and its DNA-bound complexes. (A) Classes from the DNA-PKcs volume. Each pair of images represents a projection from the final volume and the corresponding average from the original data. (B and C) Two views of the DNA-PKcs volume. The inset in (B) shows a comparable view of ATM. Scale bar represents 7 nm. (D) Classes from the DNA-bound structure. (E and F) Two views of the DNA-bound complex at similar orientations to those in (B and C).

An official website of the United States government
Here's how you know
Official websites use .gov
A
.gov website belongs to an official
government organization in the United States.
Secure .gov websites use HTTPS
A lock (
) or https:// means you've safely
connected to the .gov website. Share sensitive
information only on official, secure websites.
