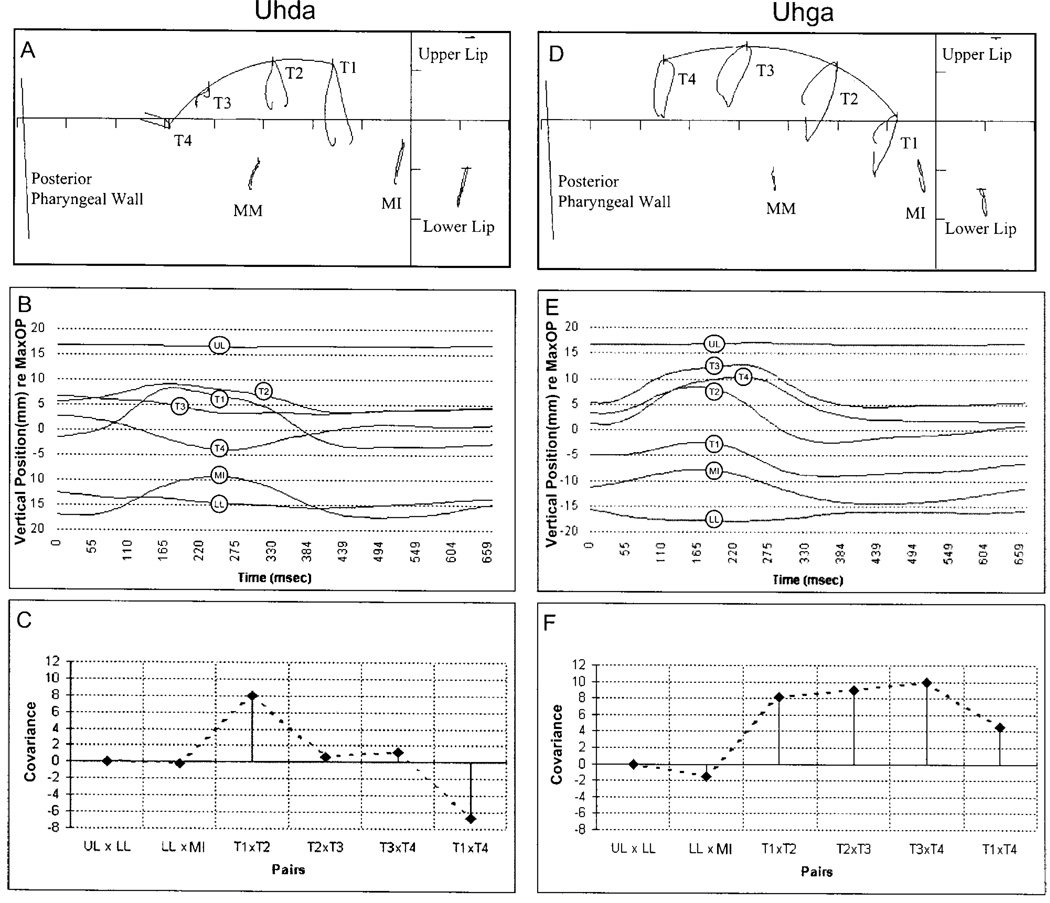
FIG. 1.
Movement data and associated coupling profiles for the utterances “uhda” and “uhga” from a single participant. Top panels: the movement path for each pellet in the mid-sagittal plane. Middle panels: the extracted vertical time histories for each pellet. Bottom panels: coupling profiles based on covariance values derived from the traces in the middle panels. The coupling profiles highlight the differences in tongue motion for these two tasks. The alveolar, as displayed in panel (c), exhibits greatest coupling between pellets T1 and T2 with little activity at other adjacent tongue regions. In addition, coupling between T1 and T4 was negative, suggesting oppositional movement. In contrast, the velar was produced with uniformly strong, positive coupling across all tongue regions. Coupling profiles provided a quantitative means to describe differences in tongue surface motion across all tasks.

