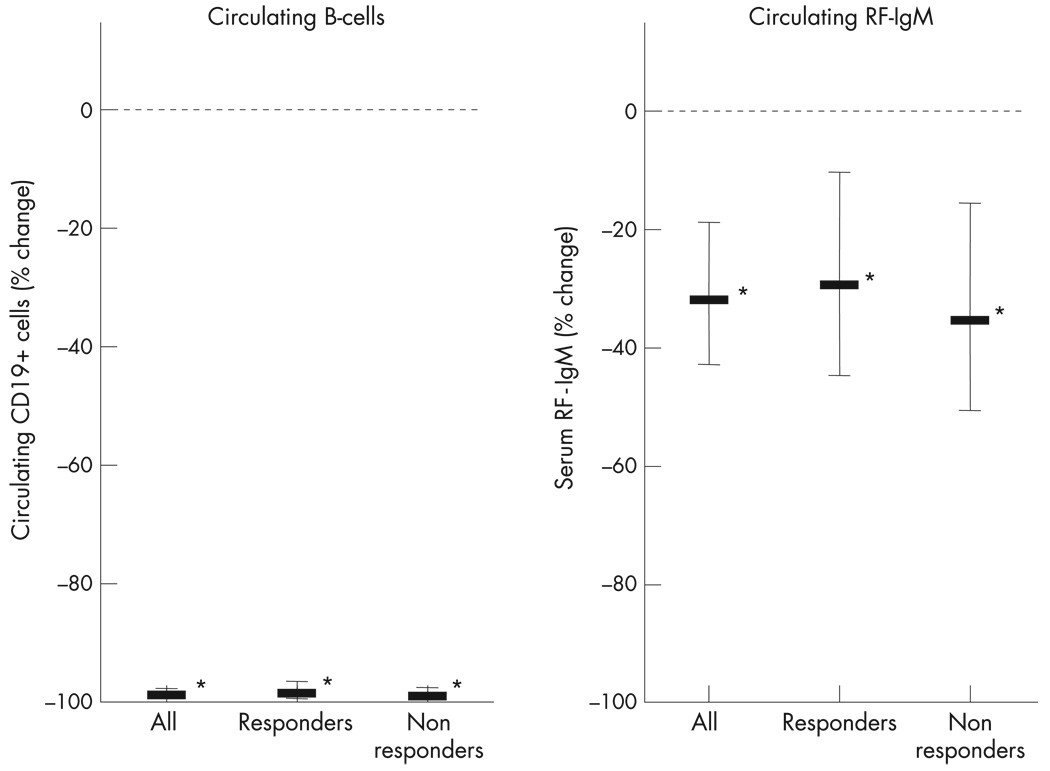
Figure 2.
Changes in circulating B cells and rheumatoid factor (RF) after rituximab therapy. Data are shown as the percentage change in values from baseline to week 8. Data is shown for all patients, and separately for patients considered as responders and non-responders. Data represents geometric mean and 95% confidence intervals. *p<0.05.

