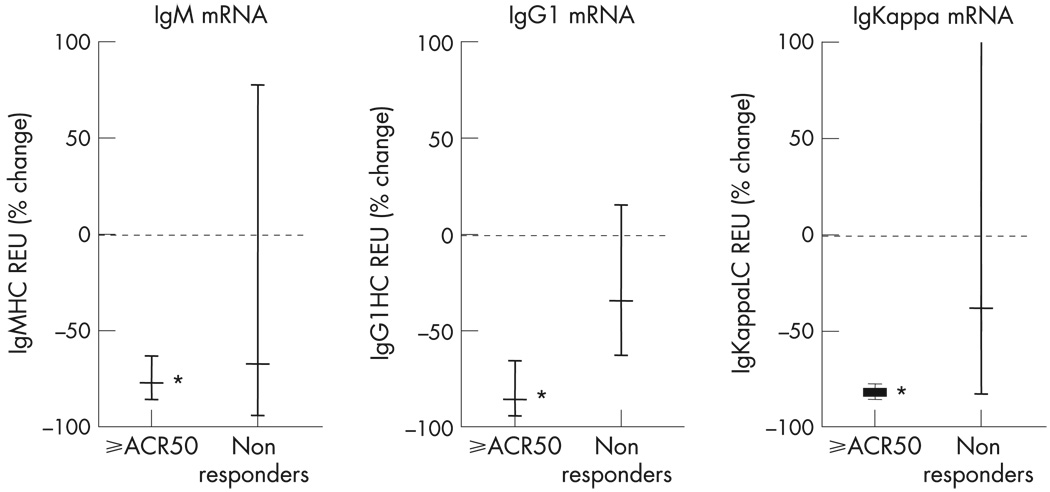
Figure 8.
Changes in synovial immunoglobulin synthesis after rituximab therapy. Data are shown as the percentage change in values from baseline to week 8. Data is shown for patients experiencing a 50% improvement in symptoms according to the American College of Rheumatology criteria (ACR50) or higher level of response during therapy (n=3) and for non-responders. Data represents geometric mean and 95% confidence intervals. *p<0.05.

