
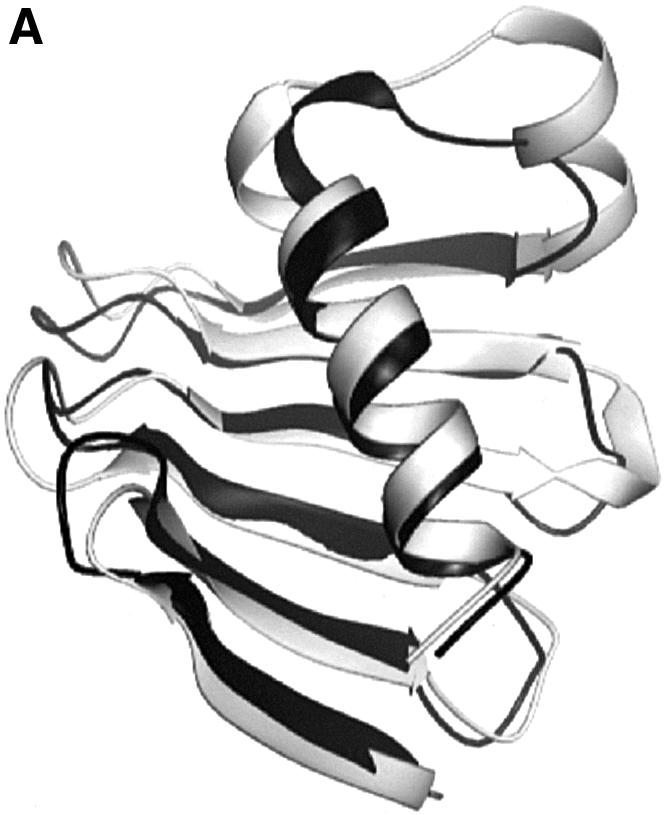

Fig. 2. Comparison of PB1 and PB2 and structure-based sequence alignment. (A) PB1 in black superimposed with PB2 in grey. The view is similar to that in Figure 1A for PB1. (B) Structure-based sequence alignment of PB1 and PB2. Structurally equivalent residues are shown in bold. Contact residues to the phospho-peptide are marked with an asterisk.