


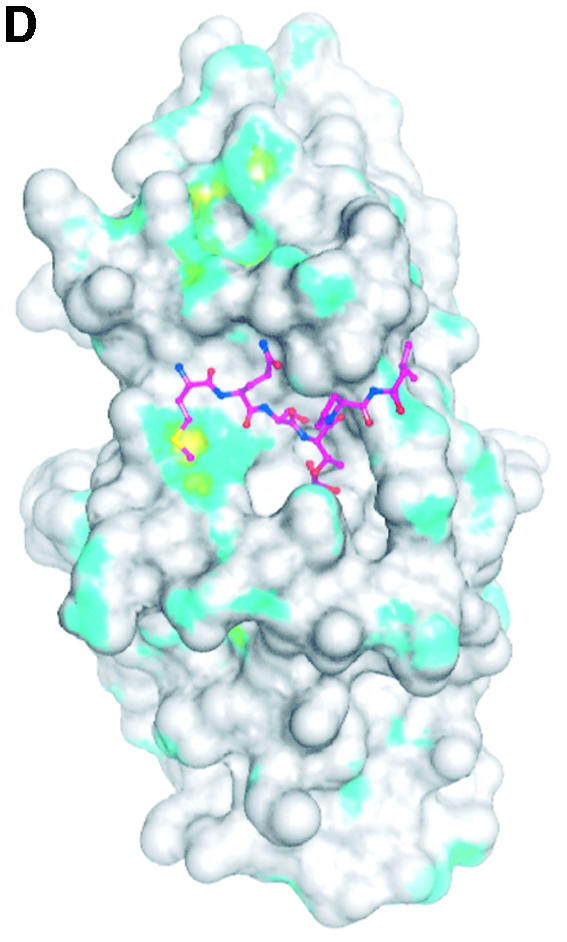
Fig. 4. The structure of the phospho-peptide–PBD complex. (A) Stereo diagram of the final 2Fo – Fc σA-weighted electron density map in the region of the phospho-peptide contoured at 1.1σ. The kink in the chain between the phospho-Thr and the proline is apparent. (B) Schematic diagram showing the Plk1 PBD and the bound phospho-peptide (magenta). The view is ∼90° to the view in Figure 1A. The N-terminal region and PB1 are in blue, and PB2 is in cyan. The linker region is in pink. The phospho-peptide (in magenta) binds between PB1 and PB2 making a short antiparallel β-sheet with β1 from PB1. Secondary structural elements that contribute contact residues are labelled. This figure is depth-cued so that parts further from the viewer appear in fainter colours. (C) Stereo diagram of the interactions between the phospho-peptide Met.Gln.Ser.pThr.Pro.Leu and the B subunit of Plk1 PBD. The view is similar to Figure 1A. Hydrogen bonds are shown as black dotted lines. The colour code is similar to that in (B) except that those residues from PB1 are in pale blue. (D) The van der Waals surface of the Plk1 PBD domain with the hydrophobic potential calculated by GRID (Goodford, 1985) displayed. The deepest hydrophobic potential is yellow, the medium cyan, and the neutral surface is grey. The atoms of the phospho-peptide are superimposed. The view is similar to Figure 1A. The threonine phosphate is partly obscured by the van der Waals surface of His538.