
FIGURE 2.
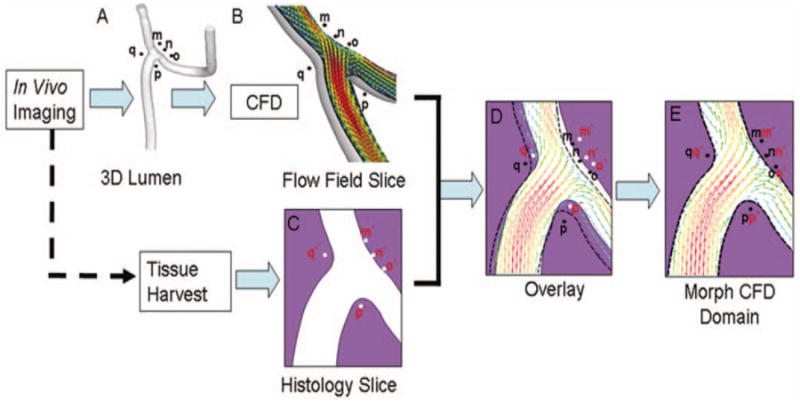
Steps involved in mapping CFD flow fields with the histological images. 3-D lumen geometry and reference points (m, n, o, p, q) were reconstructed (A) from in vivo rotational angiographic images acquired immediately before sacrifice. Then, CFD analysis was performed on this 3-D geometry, and the CFD solution was “sectioned” (B) in the same planes as the histology slides (C). These CFD slices were then superimposed onto the corresponding histological images (D). Mismatch of the two luminal geometries in D was caused by distortions on the histology slides introduced during tissue imbedding and sectioning. Using radiopaque markers (m, n, o, p, q) and arterial intersection as reference points, the CFD domain was then morphed to coincide with the histology domain (E).