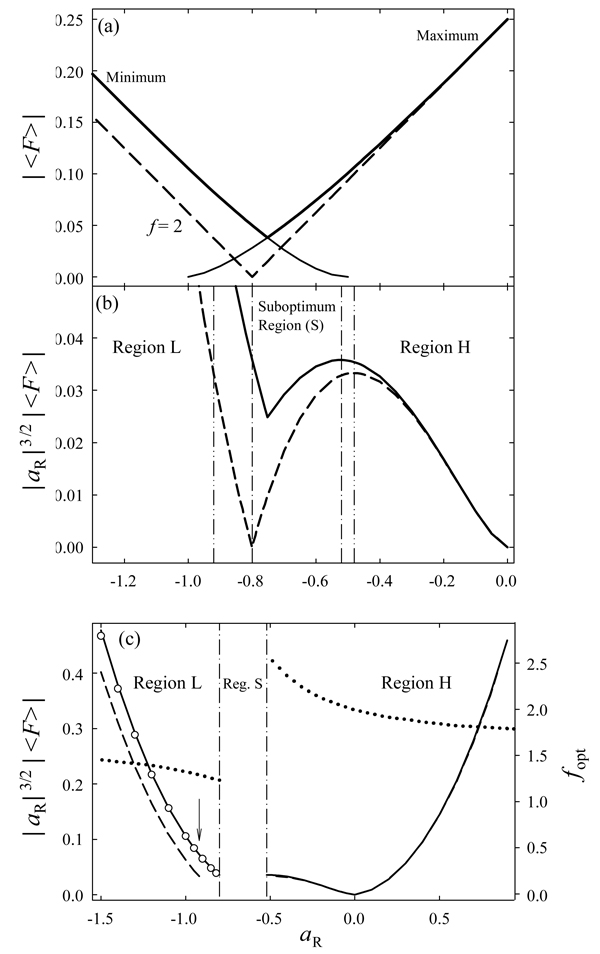
Fig. 4.
Properties of separations using rectangular E(t) with ED constraint: (a) absolute form-factor (derived from Fig. 3 c) and (b, c - left axis) absolute ion displacements per FAIMS cycle [in the units of a15/2a2−3/2K0(0)tc] for fixed (b) and variable (c) ED. Thin solid lines (a) are for maximum or minimum 〈F〉 as labeled, thick solid lines are for maximum |〈F〉|, dashed lines are for fixed f as marked, and circles (c, region L) are for f = 1.35. Vertical lines show the region boundaries: dash-dot-dot (b) for fixed f and dash-dot (b, c) for variable f. In (c), the arrow points to the greatest difference between |d| with optimum f and f = 2 (that is best at aR = 0) and the dotted line shows optimum f (right axis).

