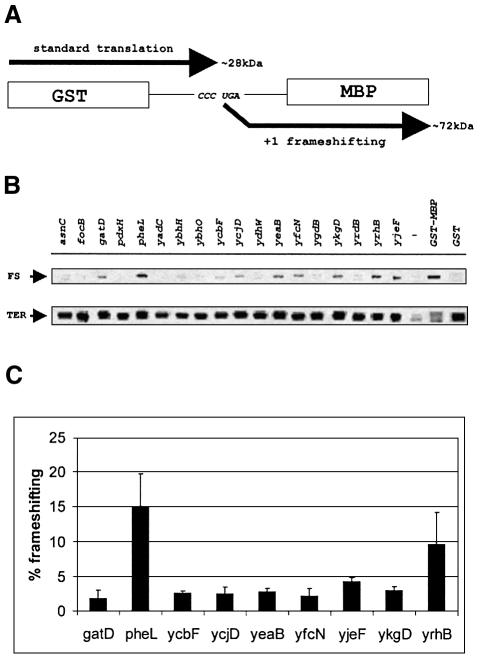
Fig. 4. Measurement of the frameshifting efficiency in cassettes with sequences from genes ending with CCC_UGA. (A) Schematic representation of expression constructs for analysis of frameshifting efficiency. (B) Pulse–chase analysis of the products expressed from vectors containing inserts of different genes ending with CCC_UGA. The areas from the gels corresponding to the termination and frameshifting products are shown. FS indicates frameshift product; TER indicates termination product. The GST lane shows the corresponding products from the parental vector in which the stop codon is located after GST; the GST–MBP lane shows products from the parental vector in which the GST and MBP genes are in-frame. The (–) lane contains labeled proteins from uninduced control. (C) Quantitation of the frameshifting efficiency. Average frameshifting efficiency of three independent pulse–chase experiments was calculated for each construct and is represented by black bars. Sequences in which frameshifting is <1% are omitted. Error bars show standard deviations.

An official website of the United States government
Here's how you know
Official websites use .gov
A
.gov website belongs to an official
government organization in the United States.
Secure .gov websites use HTTPS
A lock (
) or https:// means you've safely
connected to the .gov website. Share sensitive
information only on official, secure websites.
