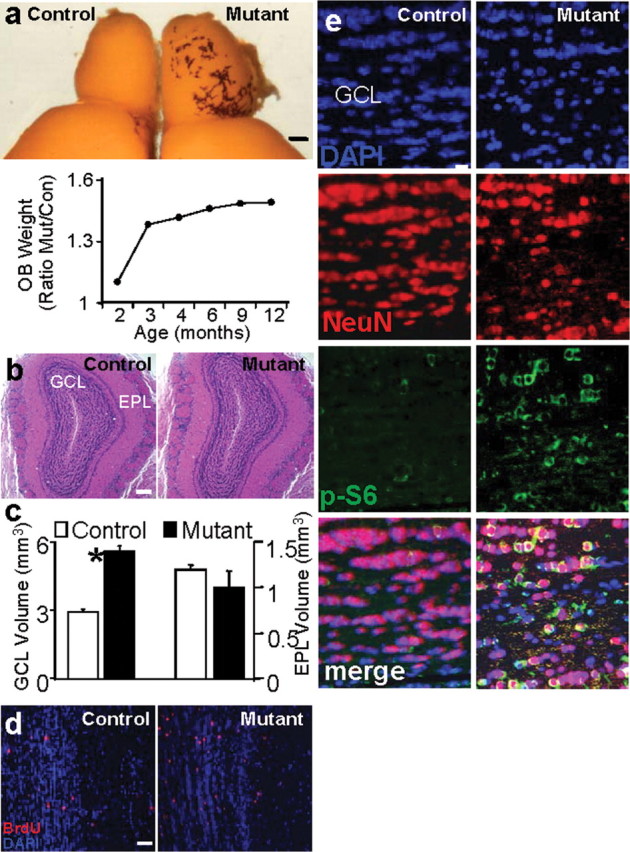
Figure 5.

Increased OB mass and enhanced proliferation and migration of SEZ-born progenitors to the GCL of OB in mutant mice. a, Enlarged OB of mutant mice. Photo shows a brain hemisphere from age-matched control and mutant mice. Scale bar, 1 mm. Panel below depicts the progressive increase in the ratio of mutant/control OB weight. n = 40. b, Histological analysis of OB section from control and mutant mice reveals normal histoarchitecture. Scale bar, 500 μm. c, GCL volume is significantly increased in mutant mice (*p < 0.05) whereas no significant change is observed in EPL (p > 0.05). Data are means ± SEM; n = 10. d, SEZ-born neuroblast migration was analyzed by BrdU pulse-labeling. Mice were injected with 200 mg/kg BrdU peritoneally, and distribution of BrdU-labeled cells was determined 2 weeks after injection. An increased number of BrdU-labeled cells within mutant GCL indicated Pten mutant mice had a significant increase in cell number at 2 weeks post injection. Scale bar, 100 μm. n = 5. e, Representative GCL images show enhanced immunoreactivity for NeuN and increased NeuN/P-S6 double positive cells in mutant when compared with a matched control region. DAPI is used as counterstain to visualize nuclei. Scale bar, 10 μm. OB, Olfactory bulb; GCL, granule cell layer; EPL, external plexiform layer.
