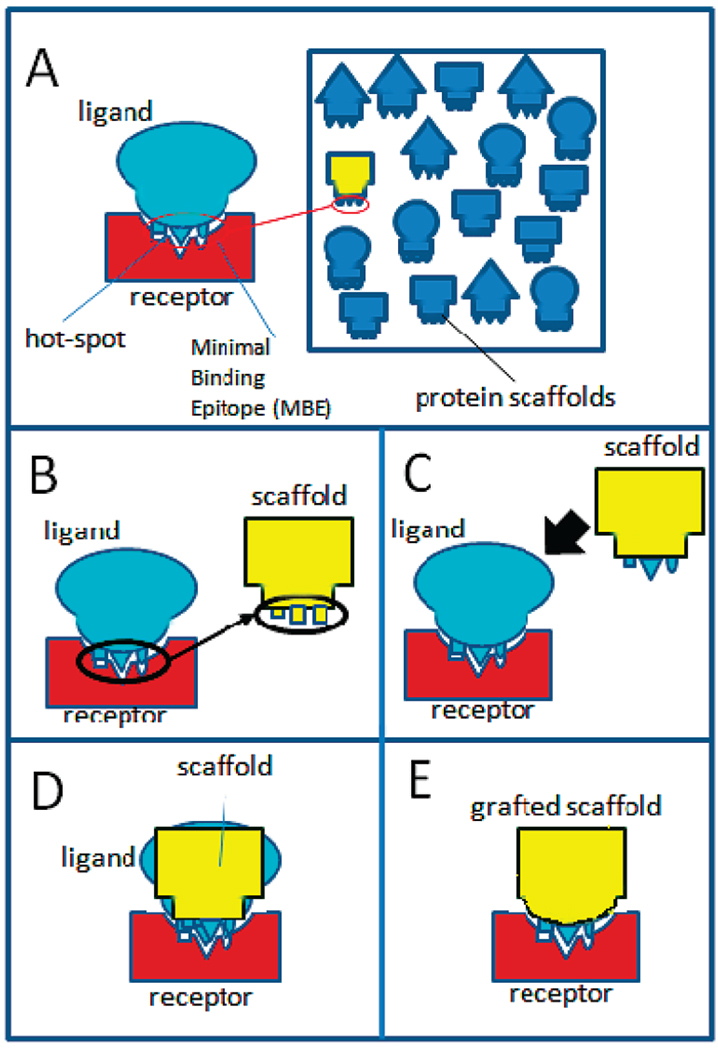
FIGURE 1.
Schematic representation of the grafting process. (A) Scanning of a large database for scaffold proteins with minimal binding epitope (MBE); (B) transfer of MBE from bound ligand to scaffold; (C) superimposition of scaffold to ligand using atoms in MBE; (D) grafting of surface of scaffold to complement receptor binding surface. (E) Final complex of receptor with grafted scaffold.

