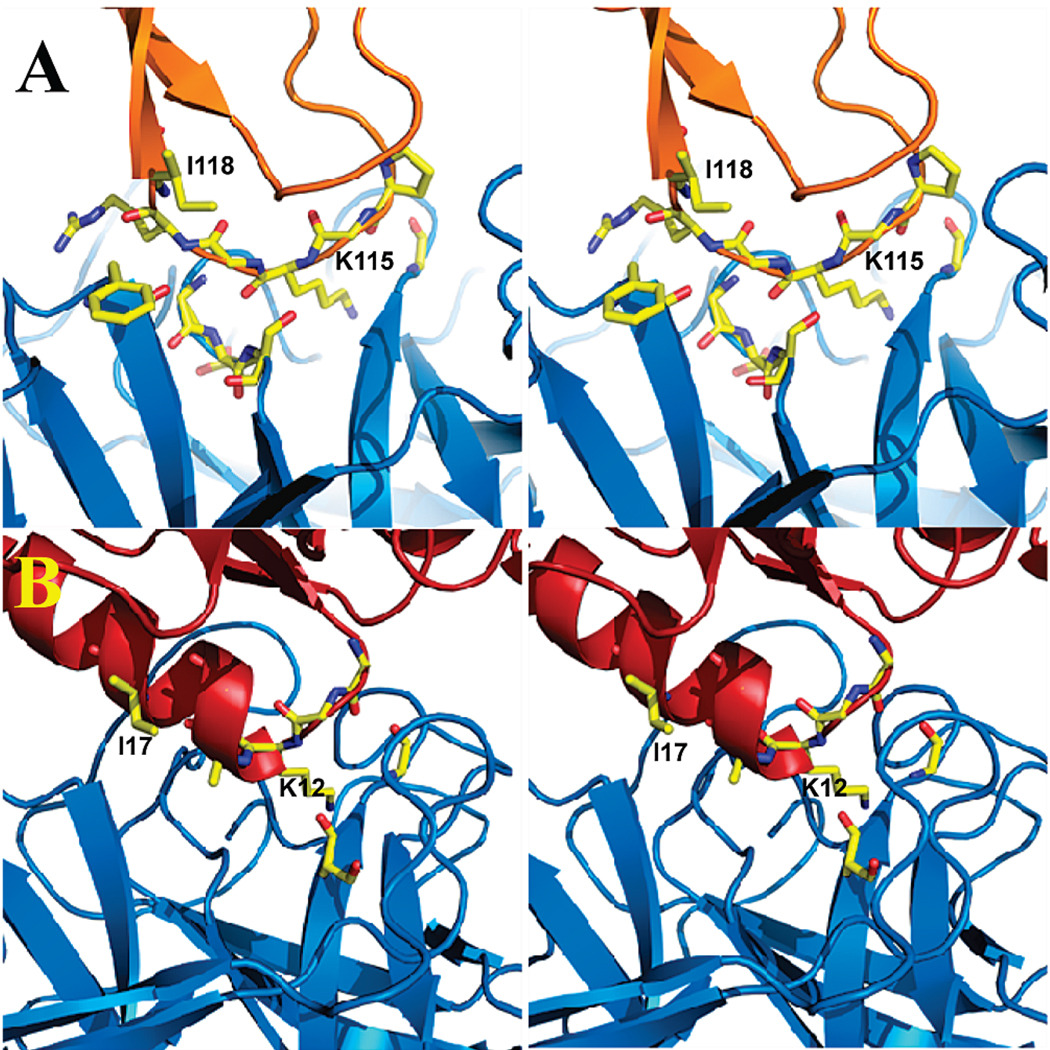
FIGURE 3.
Comparison of trypsin–BPTI and trypsin-mutated scaffold interfaces. (A) trypsin–BPTI; (B) trypsin–CheY. Proteins are shown in ribbon representation (marine blue, orange, and red for trypsin, BPTI and CheY respectively). Several residues at the interface are shown in capped stick representation color-coded according to atom types (yellow, red and blue for C, O, and N respectively).

