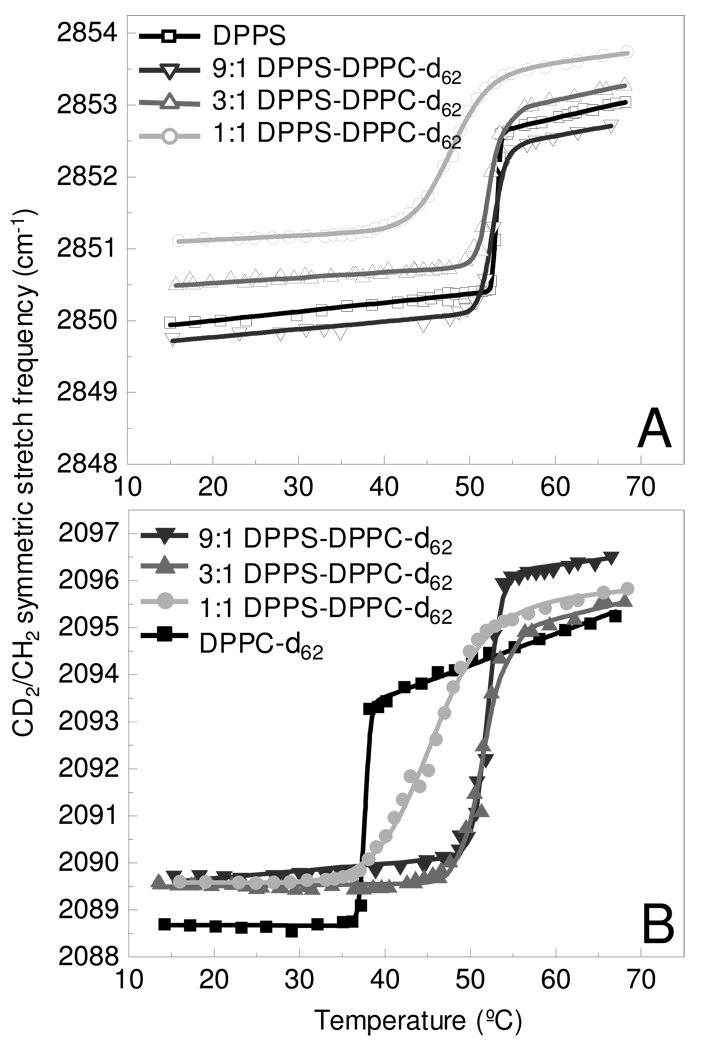
Figure 1.
Melting curves determine from the methylene symmetric stretching modes are shown for the DPPS MLVs (A) and DPPC-d62 MLVs (B) components in the binary bilayer assemblies. Melting curves are shown for the a pure lipid assembly (black) and mixed lipid assemblies comprised of 9:1 (dk. gray), 3:1 (gray), and 1:1 (lt. gray) DPPS – DPPC-d62, respectively. Lines represent the fit to a two-state model. 39

