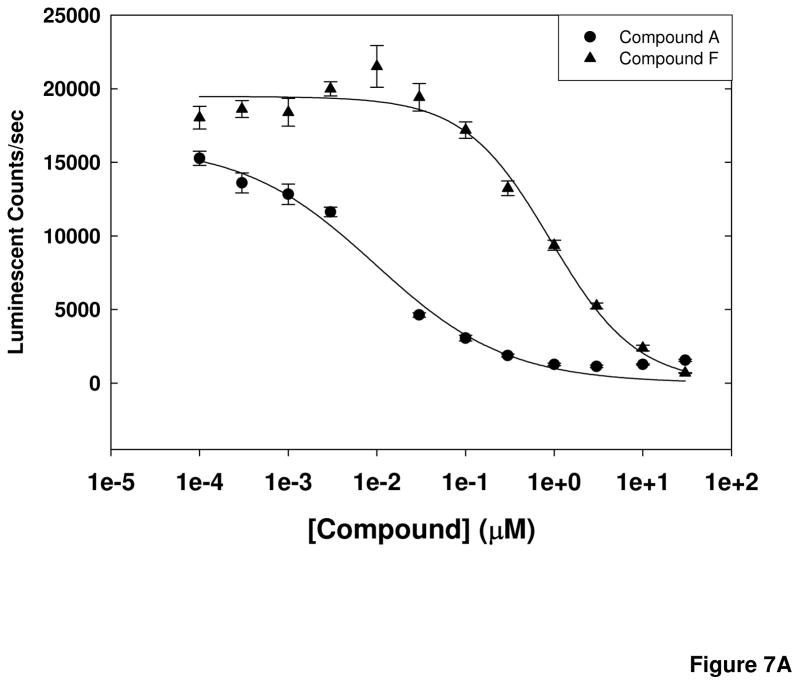
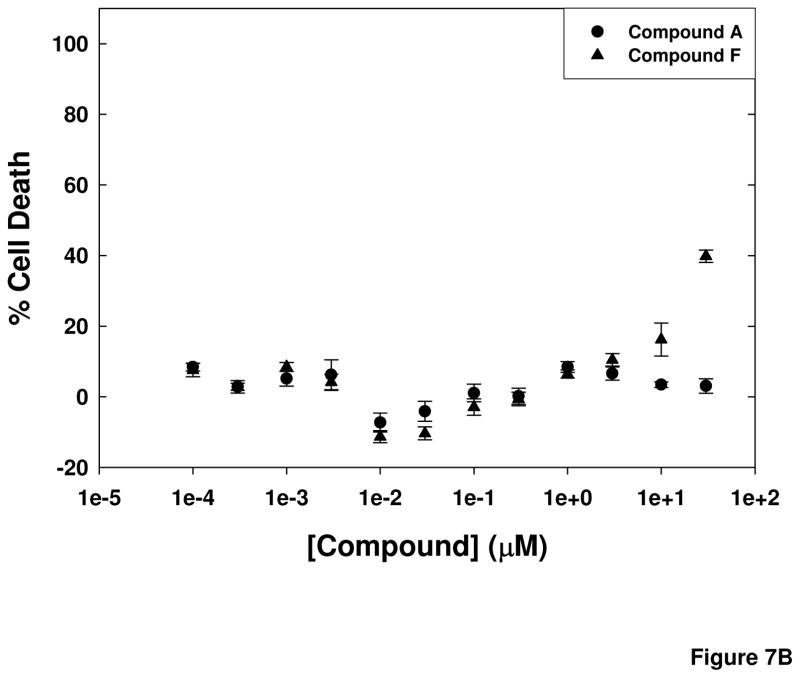
Figure 7. Cell-based calpain assay EC50 values and cell toxicity of selected compounds.
(A) Compounds were assayed at concentrations ranging from 1 nM to 30 μM in the cell-based calpain activity assay. Representative results are shown for 2 compounds tested. (B) Cell toxicity of the compounds was determined at 24 h of exposure using an assay that measures generation of ATP by the cells. Representative results for the same 2 compounds as in (A) are shown as % cell death.


