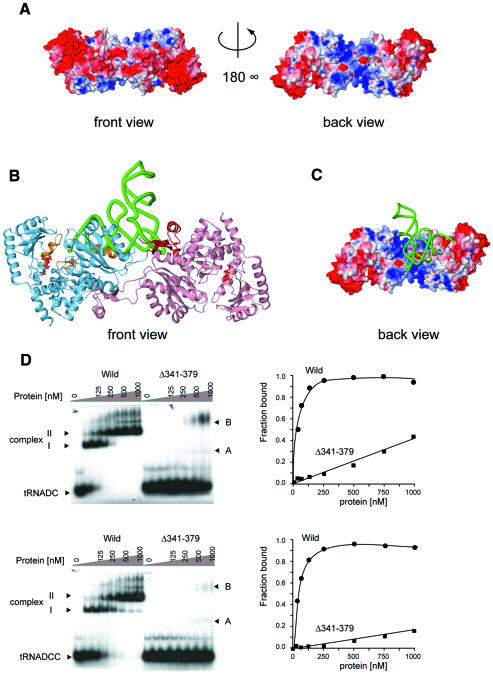
Fig. 5. (A) Two views of the A.fulgidus CCA-adding enzyme dimer showing the surface colored according to its electrostatic potential (blue, positively charged; red, negatively charged). The back view displays the back side of the dimer. (B) Ribbon diagram of the docking model of yeast tRNAPhe and the A.fulgidus CCA-adding enzyme dimer. The tRNA phosphate backbone is displayed as a green tube. The ATP bound to each active site is colored red. The putative tRNA-binding regions are colored in orange and blue, as in Figure 2. The tail domains are colored in red. The orientation is the same as the front view in (A). (C) The back side of the A.fulgidus CCA-adding enzyme dimer, to which yeast tRNAPhe is docked, is shown as in (A). (D) The tRNA [tRNA-DC (upper) and tRNA-DCC (lower)] gel retardation assays of the A.fulgidus wild-type CCA-adding enzyme (circles) and the tail domain deletion mutant [Δ(341–379)] (squares). Two major complexes, denoted as complexes I and II for the wild-type, and complexes A and B for the Δ(341–379) mutant, could be detected. The Kd values of the wild-type CCA-adding enzyme toward tRNA-DC and tRNA-DCC were estimated to be 34 nM and 67 nM, respectively. Those of the Δ(341–379) mutant were estimated to be larger than 1 µM.

An official website of the United States government
Here's how you know
Official websites use .gov
A
.gov website belongs to an official
government organization in the United States.
Secure .gov websites use HTTPS
A lock (
) or https:// means you've safely
connected to the .gov website. Share sensitive
information only on official, secure websites.
