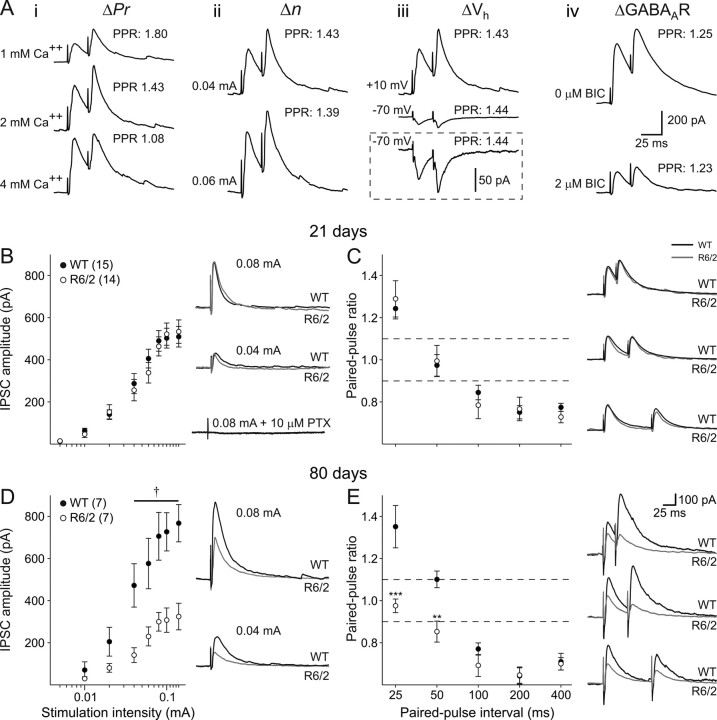
Figure 10.
Evoked IPSCs were isolated by voltage clamp at +10 mV and application of the ionotropic glutamate receptor antagonists CNQX and AP-5. Ai, Altering (Δ) Pr affected paired-pulse ratio. Decreasing extracellular calcium ion concentration from 2 to 1 mm increased PPF. Increasing extracellular calcium ion concentration from 2 to 4 mm decreased PPF. Aii, Increasing the number of release sites (n) by increasing stimulation intensity had no effect on paired-pulse ratio. Aiii, Manipulating postsynaptic electrochemical driving force by altering membrane holding potential from +10 to −70 mV had no effect on paired-pulse ratio. Inset shows the same traces on a magnified amplitude scale. Aiv, Altering postsynaptic responsiveness by partially blocking GABAA receptors had no effect on paired-pulse ratio. B, Left, The relationship between stimulus intensity and IPSC amplitude was identical in WT and R6/2 mice at 21 d. Right, Typical traces from WT and R6/2 neurons at 21 d evoked at 0.04 and 0.08 mA stimulus intensities. The addition of 10 μm PTX completely abolished the evoked current. Stimulus artifacts have been attenuated for clarity. C, Left, Paired-pulse ratios for intervals between 25 and 400 ms were unaltered at 21 d. Right, Typical paired-pulse responses at 25, 50, and 100 ms intervals in neurons from mice aged 21 d. D, Left, Relationship between stimulus intensity and evoked IPSC amplitude at 80 d. Right, Typical IPSCs in WT and R6/2 neurons. E, Left, Paired-pulse profiles from WT and R6/2 neurons at 80 d. Right, Typical paired-pulse responses at 25, 50, and 100 ms intervals from both WT and R6/2 pyramidal neurons. All x-axes for stimulus intensity plotted on a log-scale. Dashed lines indicate levels for PPF (ratio >1.1) and PPD (ratio <0.9).

