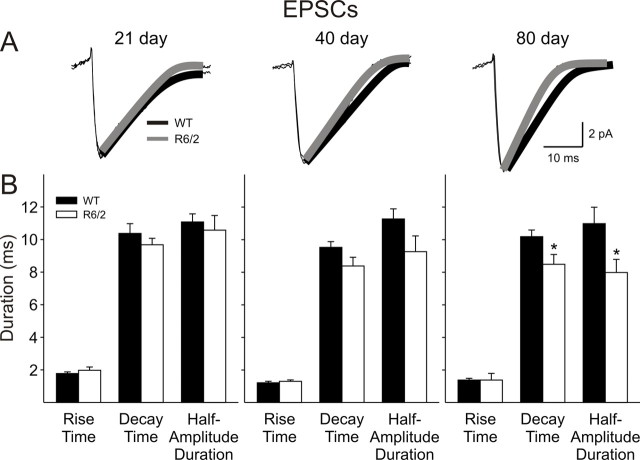
Figure 2.
A, Traces show examples of average EPSCs with an exponential fit for WT (black) and R6/2 (gray) cells at each age (n > 100 per trace). B, Bar graphs show rise times, decay times, and half-amplitude durations of spontaneous EPSCs at each age. Note the progressive decrease in decay times and half-amplitude durations of spontaneous EPSCs of R6/2 groups at 40 and 80 d.

