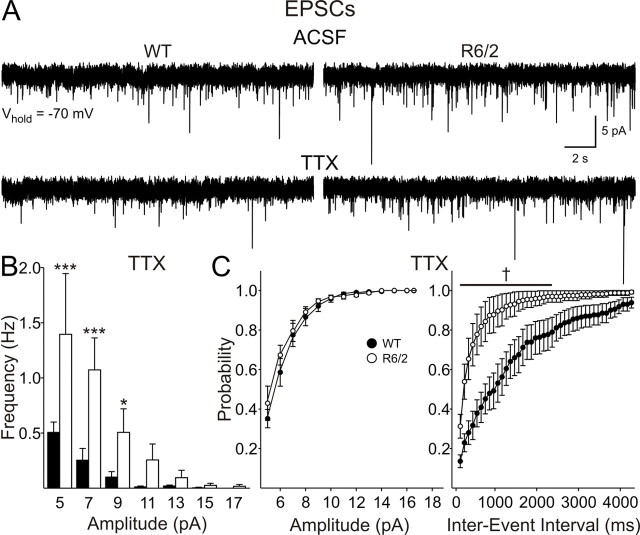
Figure 4.
Miniature EPSCs in slices from 80 d mice were isolated with TTX. A, Typical traces from cells from WT and R6/2 mice, before and after the application of TTX. B, Amplitude–frequency histograms revealed that the increases in spontaneous EPSC frequency were maintained in TTX and were therefore independent of action potentials. C, No change in cumulative amplitude plots but a greater probability of release was apparent in cumulative frequency probability plots in the presence of TTX.

