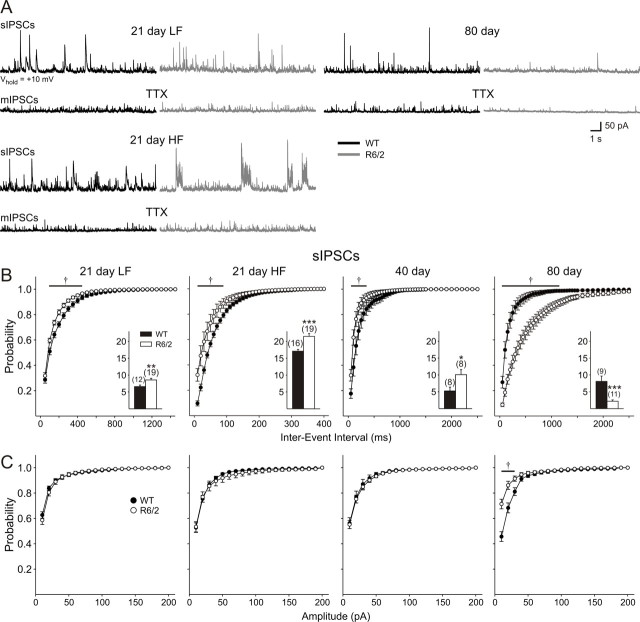
Figure 7.
A, Typical recordings of spontaneous (s) and miniature (m) IPSCs in cells voltage clamped at +10 mV. CNQX and AP-5 were present throughout the recordings, except at 80 d in the presence of TTX. At 21 d, two populations of cells were evident: an LF group and an HF group. Note the bursting pattern of activity in the HF group of cells from R6/2 mice. At 40 and 80 d, only one population could be identified. B, Cumulative frequency probability plots of spontaneous IPSCs. Insets, Mean ± SEM frequency of IPSCs for each age group. C, Cumulative amplitude probability plots. Note: Abscissa in B is plotted on different timescales to better illustrate the differences between genotypes.

