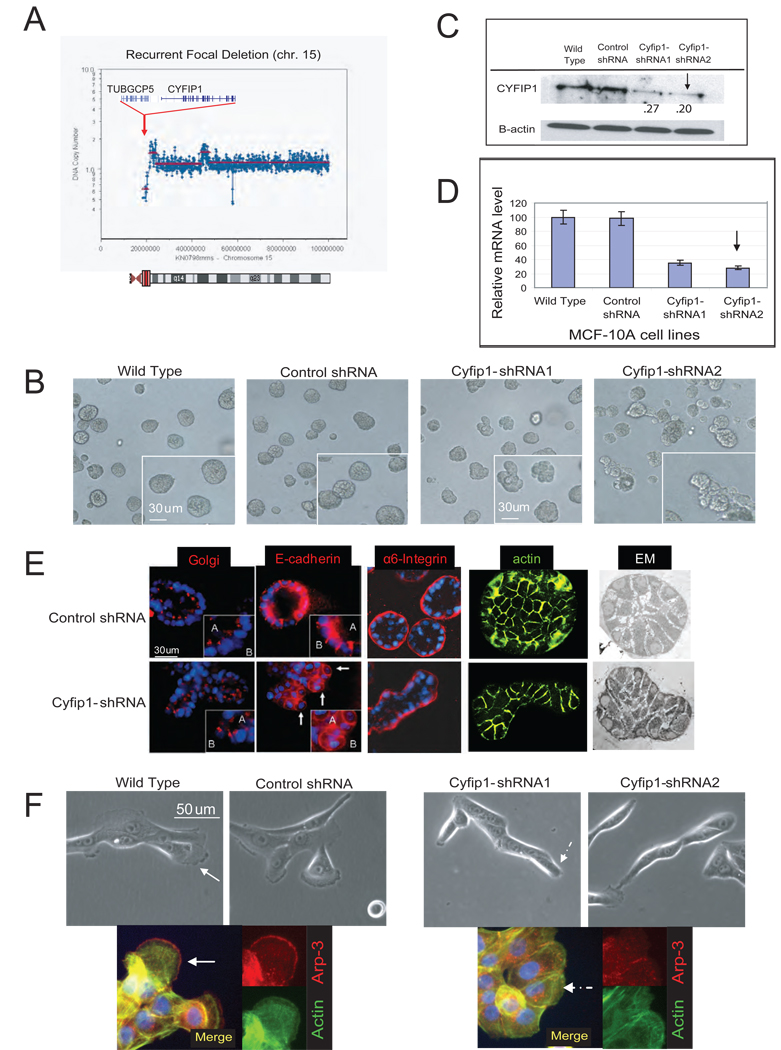
Figure 1. ROMA deletion profile of Cyfip1 and effect of knock-down on morphogenesis.
(A) Representative focal deletion found on chromosome 15 in a lung cancer sample. The genes shown correspond to the consensus epicenter of the deletion (red area in the chromosome ideogram). (B) Morphology of the acini formed by control cells (wild type and control shRNA) and Cyfip1 knock-down MCF-10A cells. (C) Level of Cyfip1 silencing in the MCF-10A cells analyzed by Western blotting and (D) quantitative RT-PCR (QRT-PCR). Error bars show standard deviation from the mean (n=3). The arrow indicates the shRNA selected for further studies. (E) Characterization of acinar architecture by Immunofluorescence and electromicroscopy (EM). (F) Morphology of the cells from panel B when grown in classical 2D cultures. The IF presents the same cells staining with Arp-3, a canonical marker of lamellipodia and actin (Boguslavsky et al., 2007). Lamellipodial structures are indicated by continuous arrows, lack of lamellipodia is indicated by discontinuous arrows..

