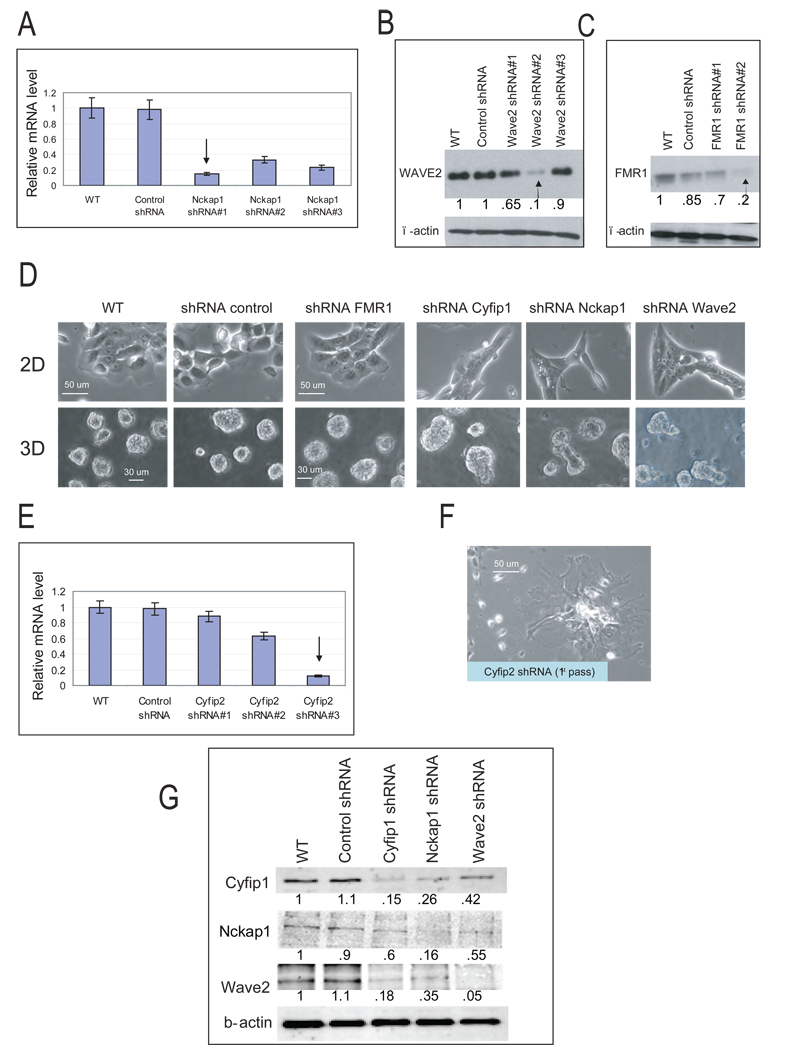
Figure 3. Silencing of WAVE complex components phenocopies the knock-down of Cyfip1.
(A) Representative morphologies of FMR1 and WAVE component knock-down cells growing in 2D and 3D culture. (B–D) Level of specific gene silencing in MCF-10A cells from panel A analyzed by Western blotting or QRT-PCR. (E) Level of Cyfip2 silencing in MCF-10A. Error bars show standard deviation from the mean (n=3). The arrow indicates the shRNA selected for further studies. (F) Representative picture of the phenotype generated in 2D cultures after silencing of Cyfip2. (G) Western blots show the steady state protein levels of Cyfip1, Nckap1 and Wave2 after individual WAVE components were silenced. The numbers inside the western-blot are the quantitative values of the bands normalized to the wild type.

